Forecasting and Analysing Sales Performance
The Forecast View provides a time-based projection of deal revenue and progress, organizing deals into configurable time period columns. The settings icon at the top-right corner allows you to configure Show By, Arrange By, Change Interval, and Number of Columns to tailor the view to your needs.
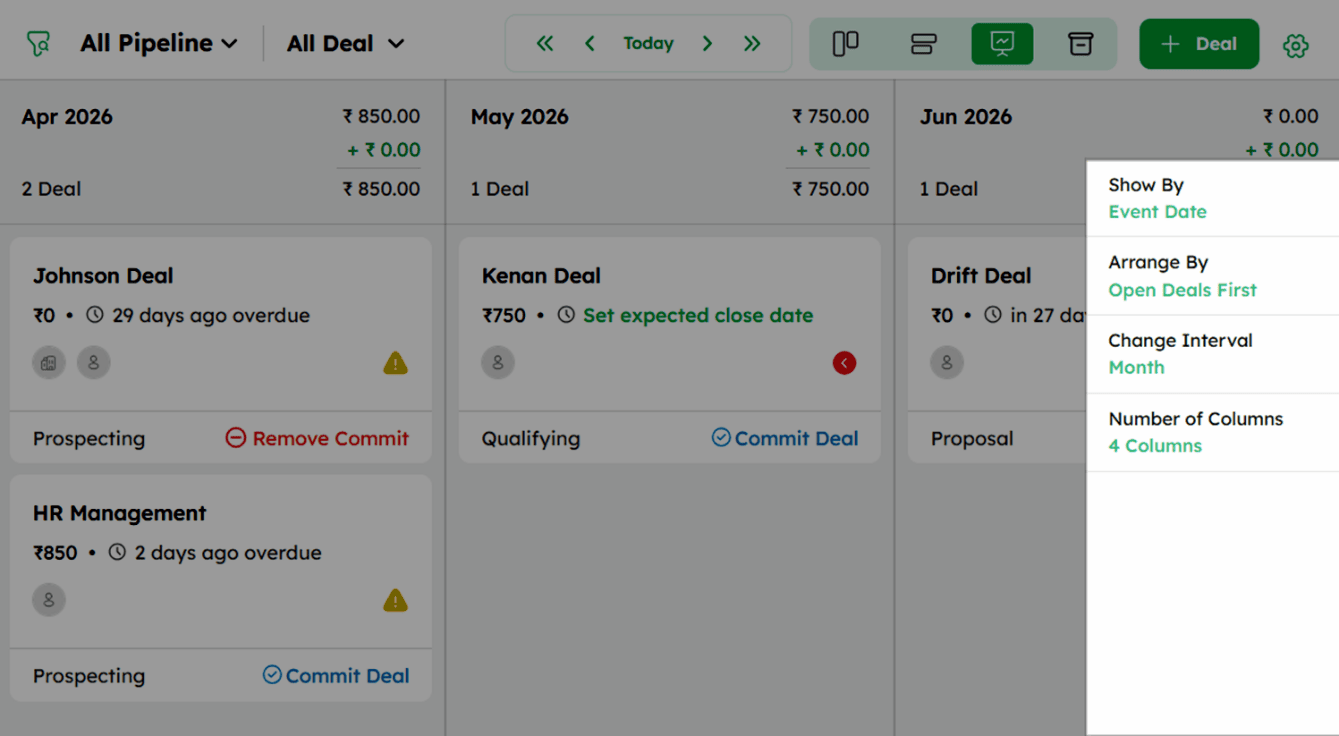
Customizing the Forecast View
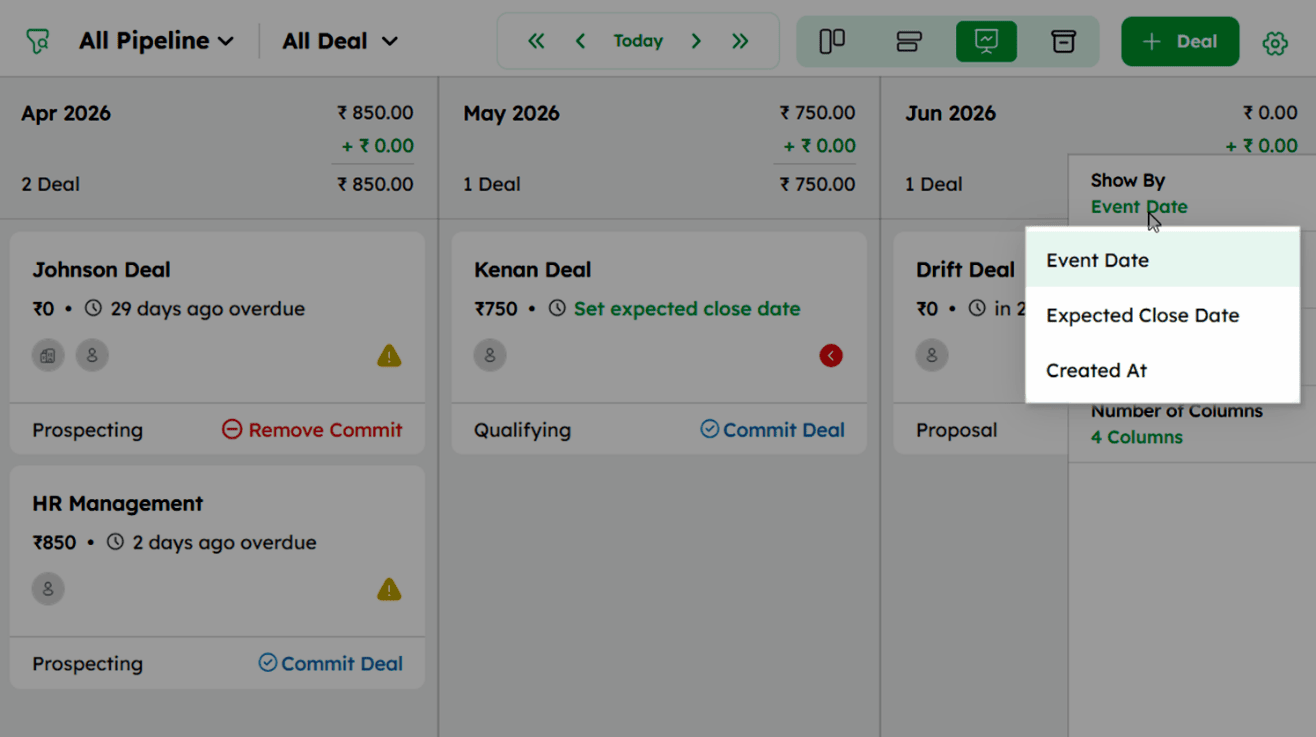
Deal Forecast View Settings: Show By
The Show By option determines the primary basis for sorting and displaying deals in the forecast view. This setting impacts how deals are organized and prioritized in the display.
-
Expected Close Date (default): Deals are displayed according to their anticipated closing date, helping you focus on upcoming closures.
-
Created At (default): Deals are sorted based on their creation date, useful for tracking recently added deals.
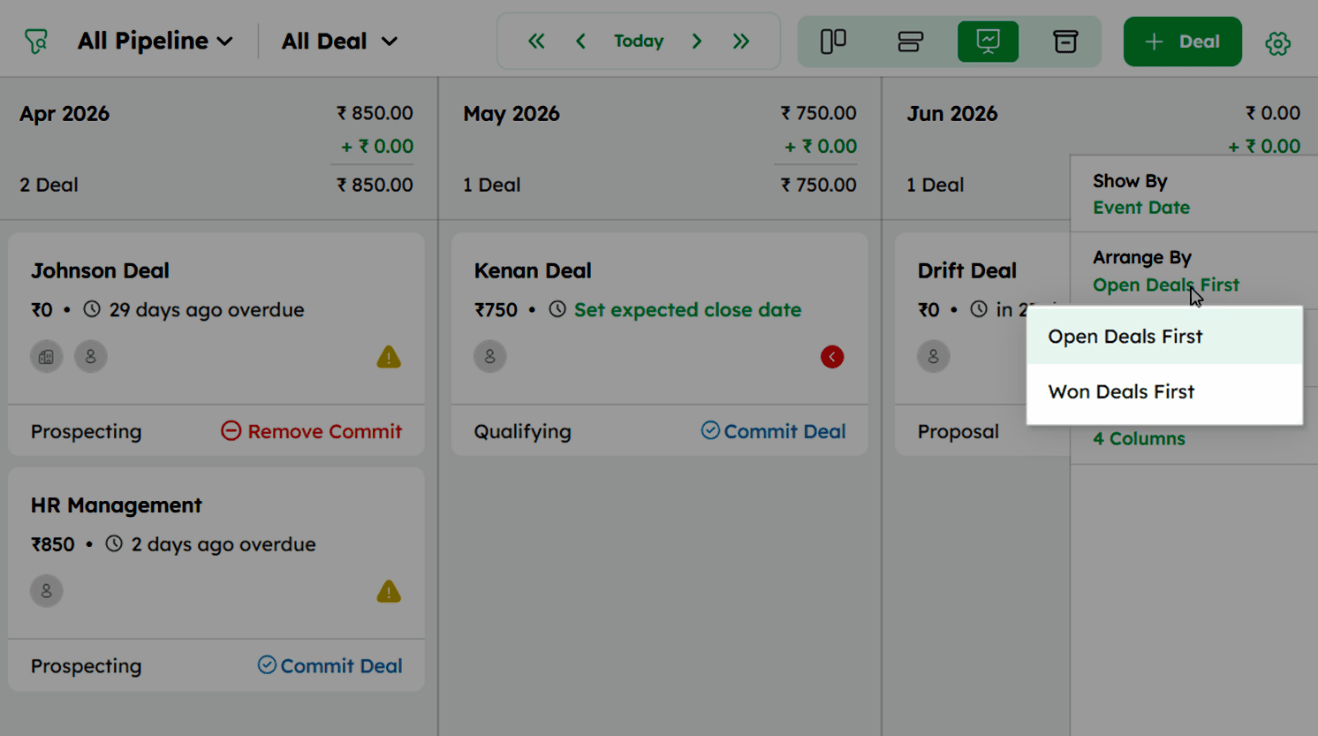
Deal Forecast View Settings: Arrange By
The Arrange By setting defines the order in which deals are displayed, either focusing on open or won deals. This setting helps prioritize how deals are presented in the view.
-
Open Deals First (default): Displays active deals at the top, with won deals listed below.
-
Won Deals First: Displays won deals at the top, with active deals listed below.
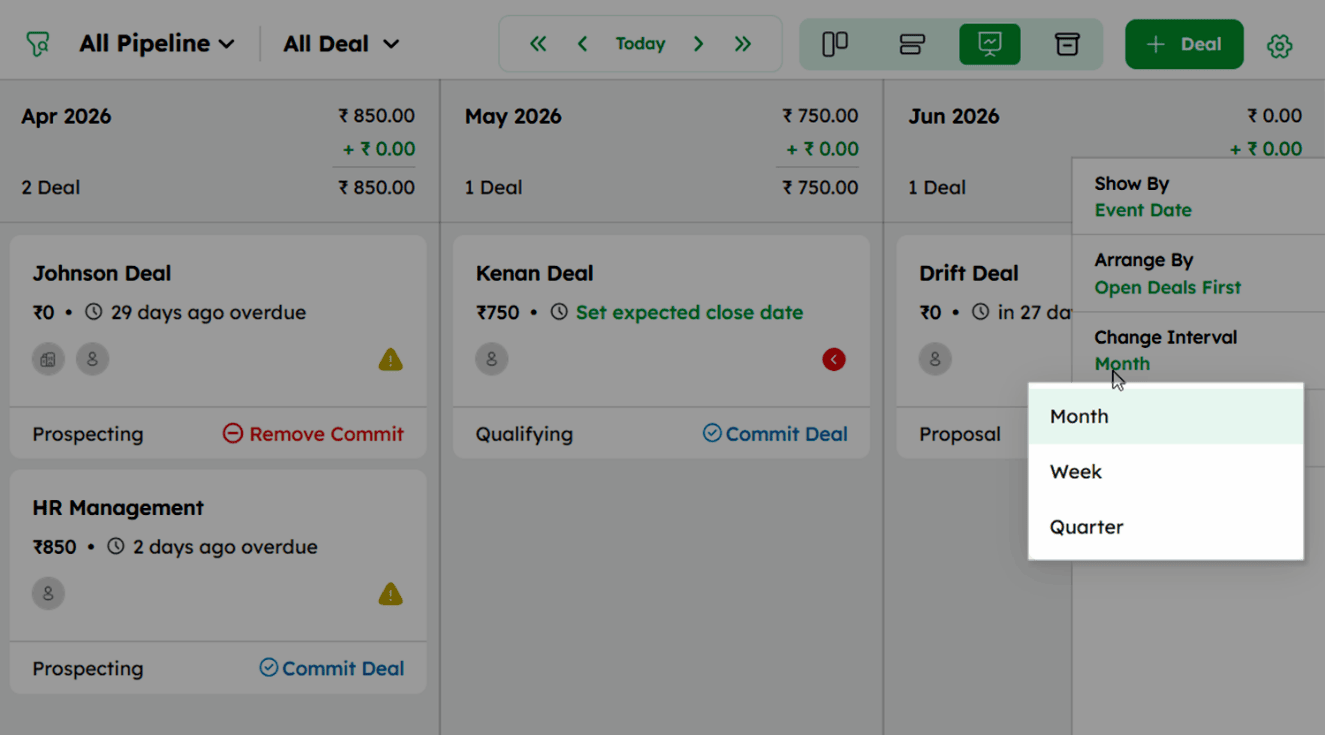
Deal Forecast View Settings: Change Interval
The Change Interval setting selects the forecast time frame - weekly, monthly, or quarterly - adjusting how deals appear in the view.
-
Month (default): Displays deals on a monthly basis, offering a broader view of progress and trends over time.
-
Week: Organizes deals on a weekly basis, useful for tracking short-term progress and planning.
-
Quarter: Shows deals organized by quarter, ideal for longer-term planning and performance review.
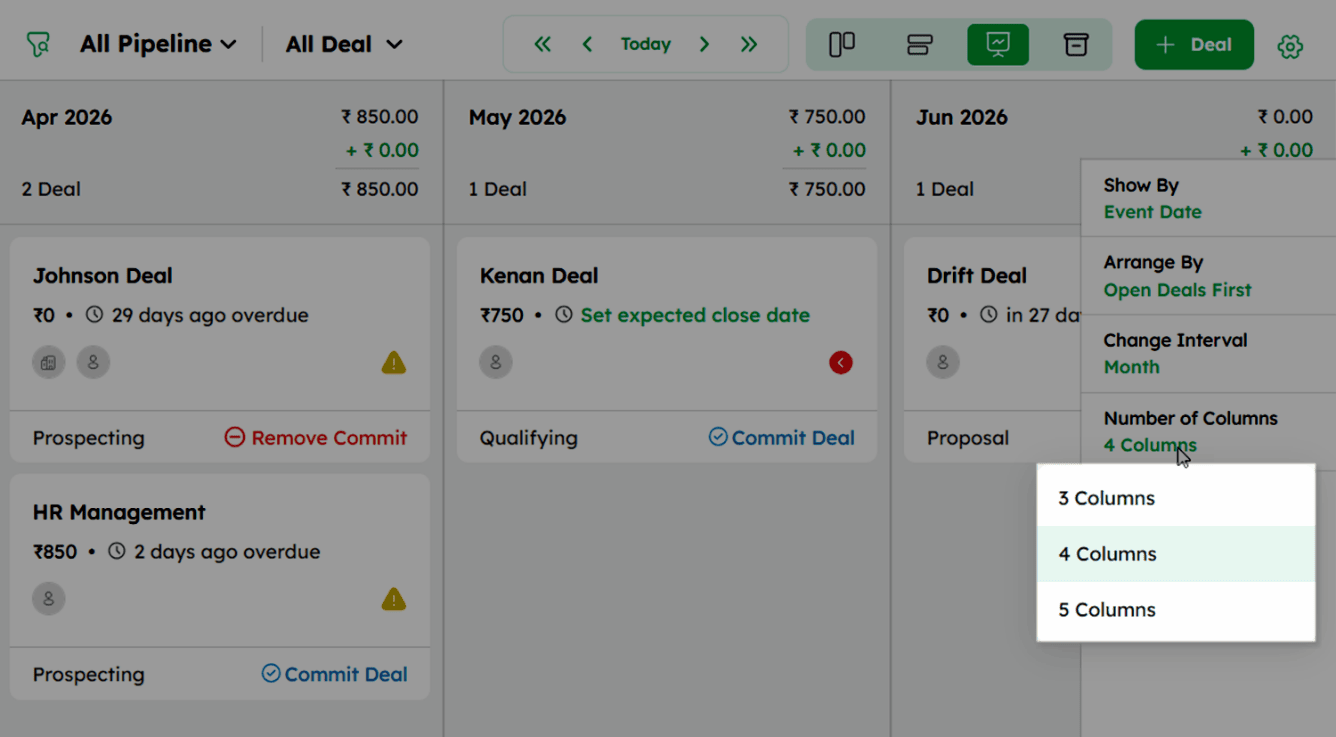
Deal Forecast View Settings: Number of Columns
The Number of Columns setting controls how many columns appear in the forecast view, adjusting the layout and deal organization.
-
3 Columns: Displays deals in three columns, providing a more condensed view.
-
4 Columns (default): Shows deals in four columns, offering a balanced layout.
-
5 Columns: Provide a wider view in five columns, allowing for broader categorization and visibility.
Switching Dates in Forecast View
The date navigation controls at the top of the Forecast View allow you to move across time periods - past, present, or future, to analyze deal performance over time.
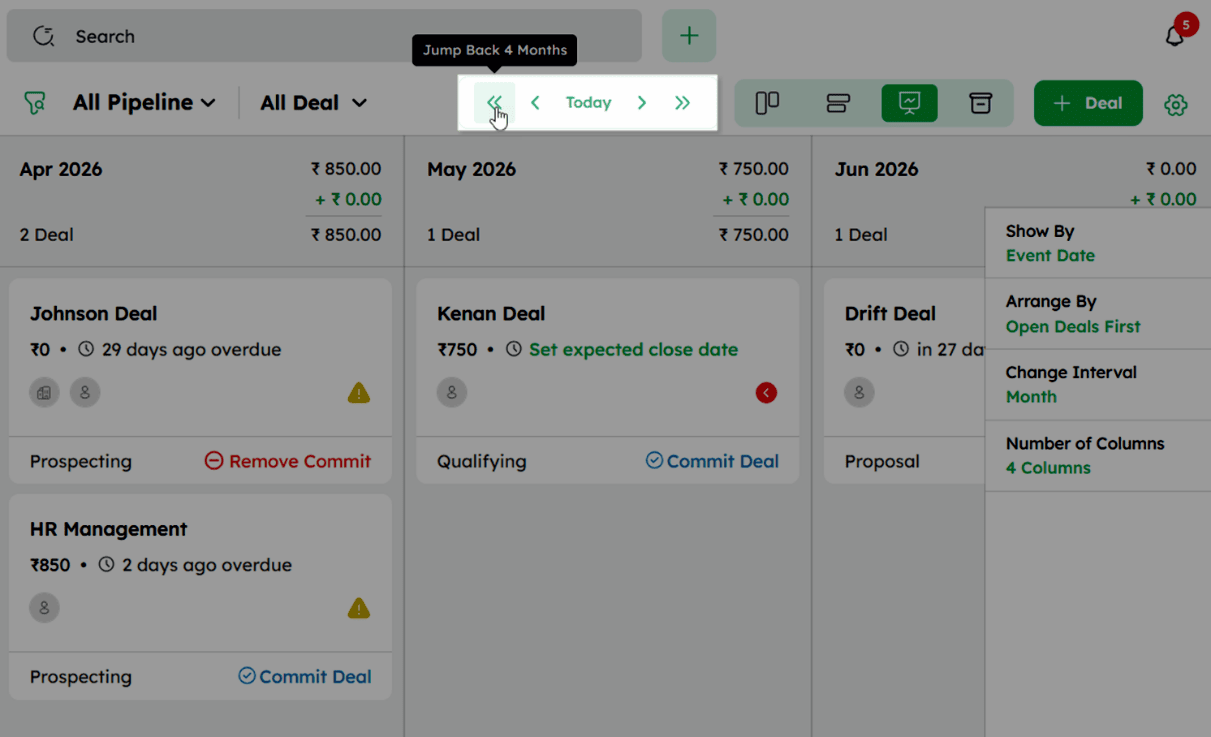
The navigation bar consists of the following controls:
-
Previous Month: Moves the view to the previous month.
-
Today: Returns the view to the current time period, organized by default column settings.
-
Next Month: Moves the view to the upcoming month.
-
Jump Back 4 Months: Moves the view back by four months to display deals from that period.
-
Jump Forward 4 Months: Moves the view forward by four months to display deals from that period.
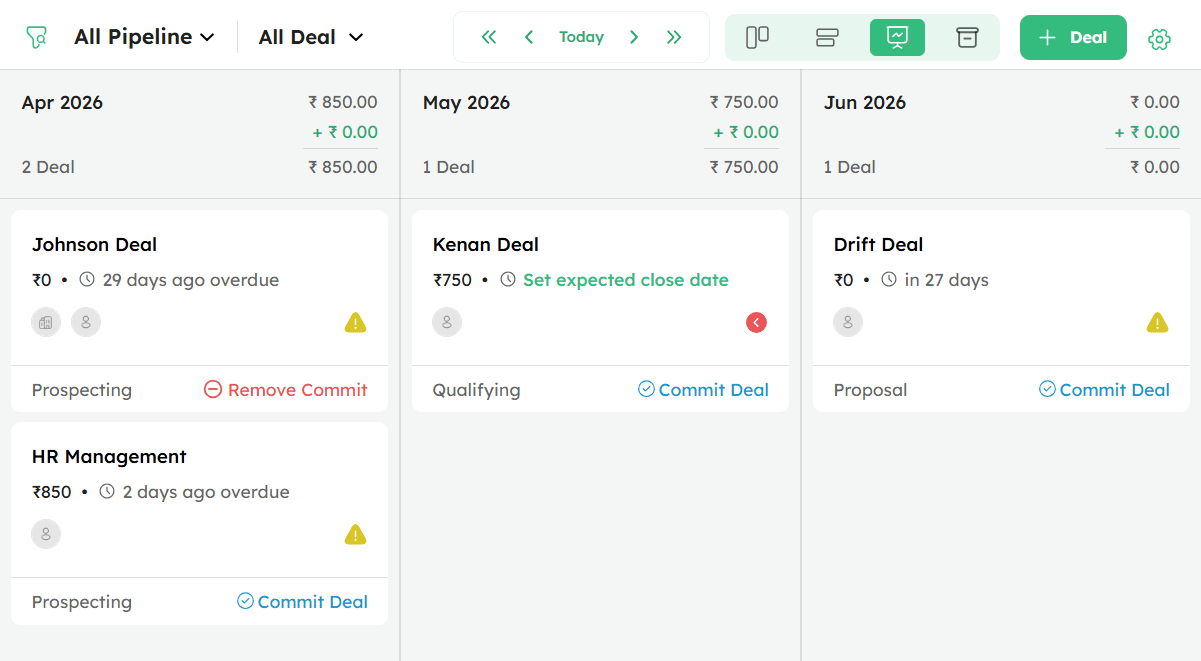
Predicting Revenue Using the Forecast View
The Forecast View provides a projected revenue overview by grouping deals according to their Expected Close Date or Created Date.
- Deals are grouped into monthly columns based on their expected close dates.
-
Each column header displays the time period, the total deal value, the won deal value, and the total deal count for that period.
-
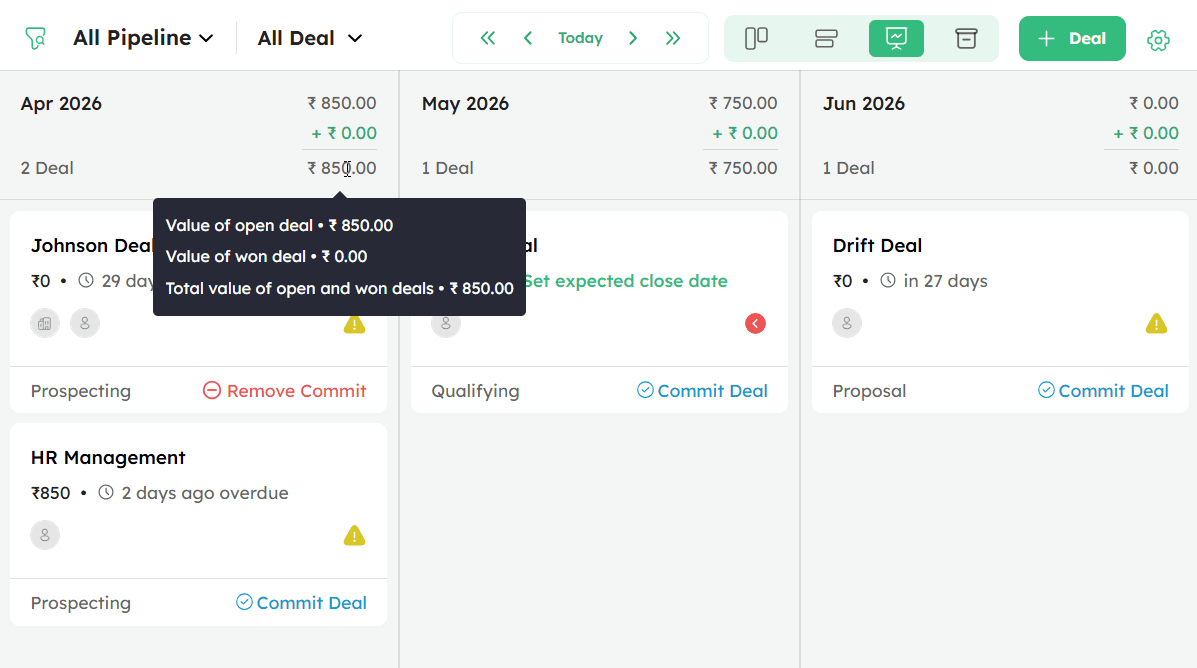
Hover over the total value in a column header to view the following breakdown:
-
Value of open deals - Displays the total value of all open deals in the selected column.
-
Value of won deals - Displays the total value of all won deals in the selected column.
-
Total value of open and won deals - Displays the combined total value of both open and won deals in the selected column.
-
-
Each deal card displays the deal name, deal value, expected close date or overdue status, associated company, sales owner, pipeline stage, and the Commit Deal or Remove Commit option.
-
Review individual deal cards within each column to track deal value, pipeline stage, and closing timeline.